Snellen Test Chart: Distance, Procedure & Results
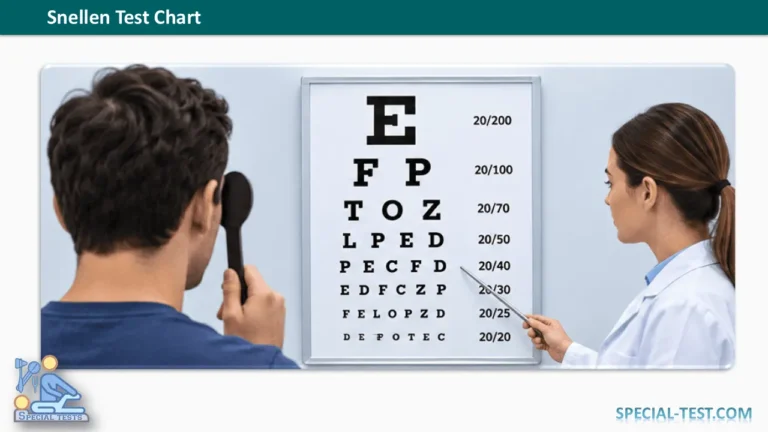
The Snellen test chart, also called the Snellen eye chart, is one of the most widely used tools for measuring distance visual acuity. It helps healthcare professionals assess how clearly a person can recognize letters or symbols at a standardized distance.
Developed by Dutch ophthalmologist Herman Snellen in 1862, the chart remains an important component of routine eye examinations, vision screening, and clinical assessment.
The Snellen test is simple, inexpensive, and noninvasive. However, accurate results depend on the correct testing distance, appropriate lighting, patient cooperation, and proper interpretation.
What Is the Snellen Test Chart?
The Snellen chart is a standardized visual acuity chart containing rows of progressively smaller letters, known as optotypes. Patients identify the letters they can see at a specified distance to determine their distance visual acuity.
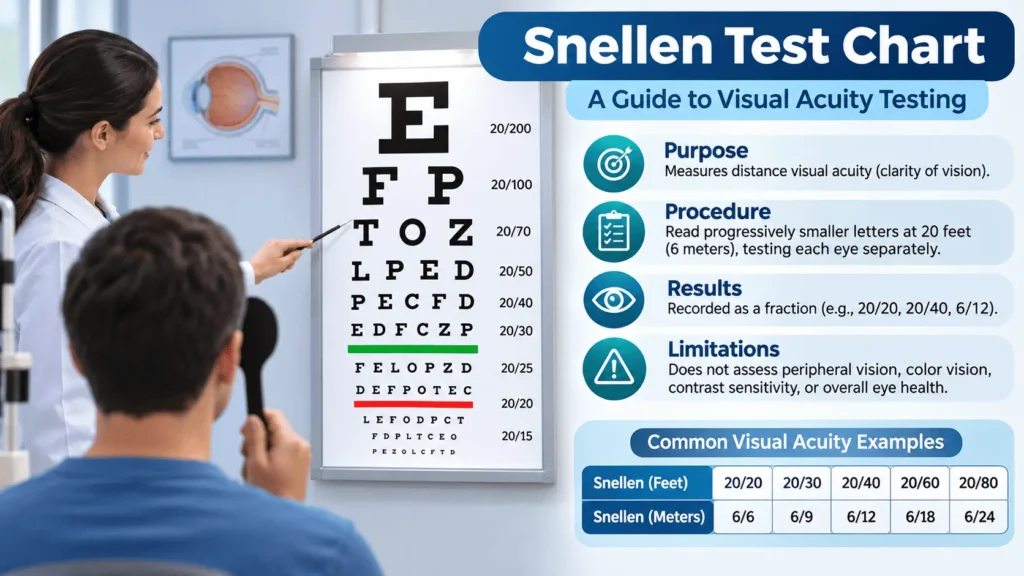
A typical Snellen eyesight chart contains a large letter at the top, followed by rows of smaller letters. Each row corresponds to a particular level of visual acuity, commonly expressed as 20/20, 20/40, or 20/200 in feet, or 6/6, 6/12, or 6/60 in meters.
The Snellen vision test primarily evaluates central visual acuity, which is the ability to distinguish fine details when looking directly at an object.
It is commonly used during:
- Routine ophthalmological examinations.
- Optometry assessments and refractive error screening.
- School and occupational vision screening.
- Evaluation of patients reporting blurred or reduced vision.
- Monitoring changes in visual acuity over time.
- Neurological and emergency eye examinations.
Although the Snellen chart provides valuable information about eyesight, it cannot independently diagnose specific eye diseases or assess every aspect of visual function.
Snellen Chart Distance: How Far Should You Stand?
The standard Snellen chart distance is 20 feet (approximately 6 meters), depending on whether the chart is designed for imperial or metric testing.
The patient must stand or sit at the distance specified for the particular chart.
Some clinics use calibrated charts designed for shorter viewing distances. Mirror systems may also provide the required optical viewing distance in examination rooms with limited space.
Using an incorrect distance can produce misleading visual acuity measurements.
How to Perform the Snellen Visual Acuity Test
The Snellen eye test should follow a standardized procedure to improve accuracy and reproducibility.
- Position the chart: Mount a correctly calibrated Snellen eye chart at an appropriate height and ensure adequate, even illumination.
- Measure the testing distance: Position the patient at the distance specified by the chart, commonly 6 meters or 20 feet.
- Assess the right eye: Cover the left eye using an occluder without applying pressure to the eye.
- Read the letters: Ask the patient to identify progressively smaller letters, continuing until they can no longer reliably recognize the optotypes.
- Record visual acuity: Document the smallest line successfully read according to the chart’s scoring convention, noting any additional correct or missed letters where appropriate.
- Repeat with the left eye: Cover the right eye and perform the same assessment.
- Assess visual correction: Document whether testing was performed with habitual distance glasses, contact lenses, or without correction. Additional testing may be necessary.
- Perform a pinhole test when indicated: If visual acuity is reduced, a pinhole occluder can help determine whether refractive blur contributes to the reduction.
For children or patients unable to identify conventional letters, alternative optotypes such as the tumbling E or picture-based charts may be appropriate.
The patient’s understanding, attention, and ability to cooperate should also be considered when interpreting the result.
How to Read a Snellen Chart: Understanding the Results
Snellen chart results are recorded as fractions, with the numerator representing the testing distance and the denominator representing the distance at which a person with standard visual acuity would ordinarily recognize the same line.
For example, a Snellen visual acuity of 20/40 means that the patient can recognize at 20 feet what a person with standard visual acuity would typically recognize at 40 feet.
The corresponding metric measurement is 6/12.
Snellen Chart Interpretation Table
| Snellen (feet) | Snellen (meters) | Interpretation |
|---|---|---|
| 20/15 | 6/4.5 | Better than standard 20/20 acuity |
| 20/20 | 6/6 | Standard reference visual acuity |
| 20/30 | 6/9 | Reduced distance visual acuity |
| 20/40 | 6/12 | Reduced distance visual acuity |
| 20/60 | 6/18 | More substantial reduction in acuity |
| 20/100 | 6/30 | Markedly reduced distance acuity |
| 20/200 | 6/60 | Severe reduction in distance acuity |
These are descriptive measurements, not diagnoses. Their clinical importance depends on the patient’s age, symptoms, ocular findings, and whether testing was performed with appropriate refractive correction.
What Does 6/6 Vision Mean?
A Snellen chart result of 6/6 is equivalent to 20/20 vision.
It means that a person can identify at 6 meters the letters expected to be recognizable at that distance by someone with standard visual acuity.
However, 6/6 vision does not necessarily indicate perfect eye health.
A person may have normal central visual acuity while experiencing abnormalities involving peripheral vision, color perception, contrast sensitivity, or other aspects of visual function.
What Does 6/12 Vision Mean?
A result of 6/12 indicates that the patient must be 6 meters away to recognize letters that someone with standard visual acuity can identify at 12 meters.
This corresponds to 20/40 vision.
Reduced acuity may result from refractive errors such as myopia or astigmatism, but other ocular conditions must also be considered.
Why Is the Snellen Eye Chart Designed With Different Letter Sizes?
Snellen optotypes are designed according to principles of visual angle.
At the designated viewing distance, a standard 20/20 (6/6) letter subtends approximately five minutes of arc, while its individual strokes have an angular width of approximately one minute of arc.
This design allows the examiner to estimate the smallest visual detail that the patient can reliably resolve.
Traditional Snellen charts have varying numbers of letters per line and nonuniform spacing. These characteristics can influence measurement precision, particularly when comparing small changes in visual acuity.
What Causes an Abnormal Snellen Test Result?
Reduced visual acuity on a Snellen chart may result from several conditions.
Refractive errors: Myopia, hyperopia, and astigmatism can interfere with the focusing of light on the retina.
Cataracts: Opacity of the crystalline lens may reduce visual clarity.
Corneal disorders: Corneal scarring, irregularity, or other abnormalities can affect optical quality.
Macular disease: Conditions affecting the central retina may significantly reduce the ability to recognize small letters.
Optic nerve or neurological disorders: Disease affecting visual pathways can also impair acuity.
Testing conditions such as poor illumination, incorrect chart distance, fatigue, limited cooperation, and inappropriate refractive correction can contribute to an unexpectedly low score.
An abnormal Snellen test therefore requires interpretation alongside the patient’s clinical history and other examination findings.
What Is the Pinhole Test in Visual Acuity Examination?
Pinhole testing is commonly used when a patient demonstrates reduced visual acuity.
The examiner places a small-aperture occluder in front of the eye and repeats the visual acuity assessment.
The pinhole restricts peripheral light rays and may reduce optical blur associated with refractive errors.
Improvement in visual acuity through a pinhole suggests that refractive error is contributing to the reduced vision.
However, pinhole improvement does not exclude coexisting ocular disease, and failure to improve does not establish a specific diagnosis.
Snellen Chart vs. LogMAR and ETDRS Charts
The Snellen chart is convenient for routine clinical examinations, but it has limitations when precise measurements or repeated comparisons are required.
The logMAR chart expresses visual acuity using the logarithm of the minimum angle of resolution.
ETDRS (Early Treatment Diabetic Retinopathy Study) charts use a standardized logMAR-based design, with more consistent letter sizing, spacing, and scoring.
Research comparing Snellen and ETDRS testing has demonstrated differences in measured visual acuity and variability, particularly among patients with poorer vision.
For example, a study involving 773 eyes found that ETDRS best-corrected visual acuity scores were, on average, approximately six letters better than the corresponding Snellen measurements.
Consequently, Snellen and ETDRS results should not automatically be treated as interchangeable, especially when monitoring subtle changes in visual function.
Can You Use a Printable Snellen Eye Chart at Home?
A printable Snellen chart may be useful for informal vision screening when printed at the correct scale and viewed from its designated testing distance.
However, simply printing an eye chart does not guarantee an accurate measurement.
The printed dimensions, viewing distance, lighting, and test instructions must match the chart’s calibration.
Similarly, online Snellen tests may be affected by screen size, display scaling, resolution, and viewing distance.
Home testing should not replace a comprehensive professional eye examination, particularly when visual symptoms are new or worsening.
Clinical Limitations of the Snellen Test
Despite its widespread use, the Snellen visual acuity test has several important limitations.
First, it primarily evaluates high-contrast central vision and does not adequately assess peripheral visual fields.
Second, patients with normal Snellen acuity may still have glaucoma, retinal disease, impaired color vision, or other ocular abnormalities.
Third, traditional Snellen charts have inconsistent numbers of letters and spacing between rows, which can affect scoring and reproducibility.
Finally, performance depends partly on the patient’s attention, literacy, cognitive abilities, and familiarity with the testing procedure.
Therefore, Snellen acuity should be considered one component of a broader ophthalmological examination rather than a standalone diagnostic test.
When Should Reduced Visual Acuity Be Evaluated?
New, unexplained, or progressively reduced visual acuity warrants professional assessment.
Sudden loss of vision, a new shadow or curtain across the visual field, flashes or new floaters associated with visual disturbance, and severe eye pain are warning symptoms that require urgent medical evaluation.
Where clinically indicated, additional investigations may include refraction, slit-lamp examination, pupil assessment, visual field testing, dilated fundus examination, or retinal imaging.
For follow-up examinations, healthcare professionals should record visual acuity separately for each eye, along with chart type, testing distance, correction status, and relevant testing conditions.
Frequently Asked Questions About the Snellen Test Chart
1. What is the Snellen chart used for?
The Snellen chart measures distance visual acuity by determining the smallest letters or symbols a patient can recognize at a standardized viewing distance. It is commonly used during routine eye examinations and vision screening.
2. What is the normal Snellen chart reading?
A Snellen result of 20/20 or 6/6 is a commonly used reference for standard distance visual acuity. However, this does not guarantee that every component of visual function or eye health is normal.
3. What is the correct Snellen chart test distance?
The conventional testing distance is 20 feet or 6 meters, depending on the chart. Calibrated shorter-distance charts and optical mirror arrangements can also be used.
4. What does 20/40 mean on an eye test?
A result of 20/40 means a person can recognize letters at 20 feet that someone with standard visual acuity could ordinarily recognize at 40 feet. It corresponds to 6/12 and does not mean vision is literally half as good.
5. Can a Snellen chart diagnose glaucoma?
No. A Snellen chart measures central visual acuity, whereas glaucoma can produce peripheral visual field loss even when central acuity remains relatively preserved. Glaucoma assessment requires additional clinical examination and testing.
6. Should you wear glasses during the Snellen test?
Visual acuity can be evaluated with or without glasses or contact lenses, depending on the purpose of testing. The examiner should clearly document whether the measurement was corrected or uncorrected.
7. Can children take the Snellen eye test?
Yes, although young children may require age-appropriate alternatives such as picture charts, matching symbols, or tumbling E optotypes instead of conventional letters.
8. Is a printable or online Snellen chart accurate?
Printable or digital charts may support informal screening when correctly calibrated. Nevertheless, incorrect scaling, distance, lighting, or display settings can affect accuracy. They should not replace a professional eye examination.
9. What is the difference between 20/20 and 6/6 vision?
There is no meaningful difference in the visual acuity represented. The 20/20 notation uses feet, while 6/6 uses meters. Both describe standard reference distance visual acuity.
10. Does 20/20 vision mean the eyes are completely healthy?
No. Normal central visual acuity does not rule out peripheral field defects, early eye disease, abnormalities of color vision, or other visual problems.
Conclusion
The Snellen test chart remains a practical and widely recognized method of assessing distance visual acuity. Its standardized letters and straightforward scoring make it useful in ophthalmology, optometry, primary care, and vision screening.
Accurate measurement requires proper chart calibration, correct viewing distance, appropriate illumination, and clear documentation of each eye’s performance.
Understanding the Snellen chart results, including 20/20, 20/40, 6/6, and 6/12, helps clinicians and patients communicate changes in visual acuity.
Nevertheless, a Snellen eye test cannot independently diagnose eye disease or exclude all potentially serious visual abnormalities. Results should always be interpreted alongside the patient’s symptoms, clinical history, and other appropriate ophthalmic examinations.
References
- Tripathy K, Gupta A. Evaluation of Visual Acuity. StatPearls. NCBI Bookshelf. https://www.ncbi.nlm.nih.gov/books/NBK564307/
- Snellen Chart. StatPearls. NCBI Bookshelf. https://www.ncbi.nlm.nih.gov/books/NBK558961/
- Levenson JH, Kozarsky A. Visual Acuity. Clinical Methods: The History, Physical, and Laboratory Examinations. NCBI Bookshelf. https://www.ncbi.nlm.nih.gov/books/NBK219/
- Visual Acuity Variability: Comparing Discrepancies Between Snellen and ETDRS Measurements Among Subjects Entering Prospective Trials. PubMed. https://pubmed.ncbi.nlm.nih.gov/32595096/
- Prospective Evaluation of Visual Acuity Assessment: A Comparison of Snellen Versus ETDRS Charts in Clinical Practice. PubMed. https://pubmed.ncbi.nlm.nih.gov/20126505/
- Sudden Vision Loss: A Diagnostic Approach. PubMed. https://pubmed.ncbi.nlm.nih.gov/39823616/